The square root curve is a foundational concept in mathematics, commonly encountered in fields such as algebra, geometry, and numerous real-world applications. This curve illustrates the relationship between numbers and their square roots, providing valuable insights into mathematical principles. Its distinctive shape, which rises gradually and then levels off, is essential for solving a variety of problems, from basic calculations to complex equations. Understanding the square root curve not only enhances our grasp of mathematical relationships but also aids in applications like physics, engineering, and economics, where these principles frequently come into play. By studying this curve, we can develop stronger problem-solving skills and a deeper appreciation for the interconnectedness of mathematical concepts.
Definition of the Square Root Curve
The square root curve represents the graph of the square root function, defined mathematically as:
Characteristics of the Curve
Starting Point
The square root curve begins at the origin, specifically at the coordinate point (0, 0). This starting point is significant because it demonstrates that when the input x is zero, the output y is also zero. In practical terms, this means that there is no quantity to extract a square root from when we have zero; thus, the relationship defined by the square root function naturally starts from this point. The origin serves as a foundational reference for understanding the behavior of the curve as it progresses into positive values.
Growth Rate
As x increases, the square root curve rises gradually, showcasing a unique growth pattern. Initially, the increase in y is quite slow, indicating that even as x becomes larger, the corresponding value of y does not increase sharply. This characteristic illustrates the principle of diminishing returns inherent in the square root function; the outputs grow at a decreasing rate as the inputs grow. For example, moving from x=1 to x=4 results in a change in y from 1 to 2, while moving from x=4 to x=9 results in a change in y from 2 to 3. This gradual rise is essential for understanding how the square root function behaves, especially in real-world applications where such relationships are frequently observed.
Positivity
The values of the square root function are always positive, which is a key characteristic of the square root curve. This positivity arises from the fact that square roots of negative numbers are undefined within the context of real numbers. Thus, the square root curve is confined to the first quadrant of the Cartesian plane, where both x and y values are non-negative. This limitation underscores the function’s practical applications, as it only deals with real and meaningful quantities. In various fields, such as physics and engineering, this property ensures that calculations involving the square root function yield valid and interpretable results. Understanding this positivity is crucial for applying the square root function correctly in mathematical modeling and problem-solving scenarios.
Graphing the Square Root Curve
How to Graph It
To graph the square root curve, start by marking the origin at the point (0, 0), since the square root of 0 is 0 (√0 = 0). This serves as the initial reference point for your graph.
Next, plot additional points based on the square root function. For example, consider the following points:
- (1,1): Since √
- (4,2): Since √
- (9,3): Since √
These points illustrate how the value of increases as x increases. After plotting these points, connect them with a smooth, continuous curve. The curve should rise gradually, reflecting the slow growth rate of the square root function. As you continue plotting more points, you’ll notice that the curve becomes less steep as it moves away from the origin.
Key Features
- Domain: The domain of the square root function consists of all non-negative values, expressed as x ≥ 0. This means that the function is only defined for inputs that are zero or greater. Negative values of do not yield real number outputs, which is why the graph does not extend into the negative -axis.
- Range: The range of the square root function includes all non-negative outputs, or y ≥ 0. This indicates that the function will never produce negative values, as square roots are inherently non-negative in the context of real numbers.
- Curvature and Behavior: While the square root curve lacks symmetry, it exhibits unique behaviors that can be influenced by transformations. For instance, the curve can shift horizontally or vertically, or stretch and compress based on modifications to the function, such as y = a√(x – h) + k, where a, h, and k are constants that affect the graph’s shape and position. Understanding these transformations allows for greater flexibility in applying the square root function to various mathematical contexts and real-world problems.
Properties of the Square Root Curve
Continuous and Increasing
The square root curve is characterized by its continuous nature, meaning it has no breaks or gaps; it flows smoothly across its domain. As the value of increases, the corresponding value of consistently rises, reflecting a positive relationship between the two variables. This continuous increase signifies that there are always outputs for any non-negative input, allowing for a seamless transition along the curve. The gradual ascent illustrates that while the output grows, it does so in a manner that becomes less steep over time, showcasing the characteristic slow growth of the square root function.
Asymptotic Behavior
The square root curve exhibits asymptotic behavior as approaches infinity. This means that while continues to rise indefinitely, the rate of increase diminishes as becomes very large. For instance, as increases from 1 to 4, increases from 1 to 2—a change of 1. However, as moves from 1000 to 1001, y only increases from 31.62 to 31.65, reflecting a much smaller change. This behavior illustrates that although the function continues to grow, it does so at a decreasing rate, emphasizing the concept of diminishing returns inherent in the square root function.
Transformations
The square root curve can undergo various transformations that alter its position and shape on the graph. For example, the equation y = √(x-2) shifts the curve horizontally to the right by 2 units, meaning the starting point of the curve moves from (0, 0) to (2, 0). This transformation indicates that the square root function will only return values for values greater than or equal to 2.
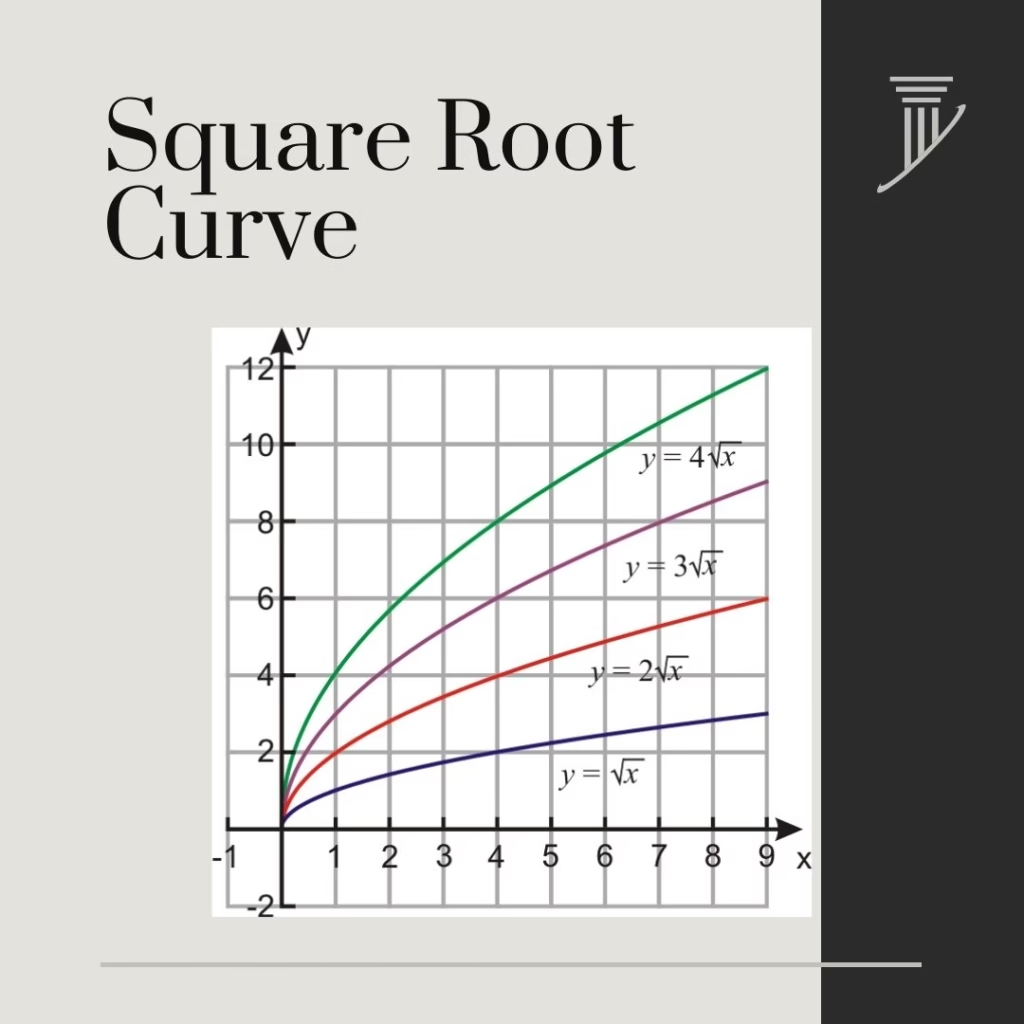
Similarly, the equation y = 2√x not only retains the original shape of the square root curve but also stretches it vertically. In this case, each output value of y is doubled, which means that the curve rises more steeply compared to the standard square root function. Understanding these transformations is crucial for applying the square root function in various contexts, allowing for greater adaptability in mathematical modeling and problem-solving. By manipulating the parameters in the equations, one can create a range of curves that meet specific analytical needs.
Applications of the Square Root Curve
The square root curve serves numerous practical purposes across various fields, demonstrating its versatility and significance in real-world applications. Here are some key areas where the square root function is particularly useful:
Physics
In the realm of physics, the square root curve effectively models relationships in motion, especially in scenarios such as projectile motion. For instance, the trajectory of a projectile follows a parabolic path, which can be analyzed using the square root function to determine the height of the projectile at different distances from the launch point. This allows physicists to predict how far an object will travel and at what height it will peak, providing essential insights into the dynamics of motion.
Economics
In economics, the square root function is often applied in utility theory to illustrate the concept of diminishing returns. As consumers increase their consumption of a good or service, the additional satisfaction (or utility) they derive from each additional unit tends to decrease. This relationship can be modeled using the square root curve, helping economists understand consumer behavior and make predictions about market dynamics. By analyzing utility functions, economists can assess how changes in consumption levels affect overall satisfaction and resource allocation.
Biology
In biological sciences, the square root curve describes growth rates in certain biological systems. For example, it can model the growth of populations under specific conditions, where growth rates slow as populations approach environmental limits. This is particularly relevant in ecological studies, where understanding population dynamics is crucial for conservation efforts and resource management. By employing the square root function, biologists can predict how populations will respond to changes in their environment or resource availability.
Engineering
Engineers frequently utilize the square root curve to solve design problems involving roots or parabolas. For instance, in structural engineering, the shape of arches and bridges can be analyzed using principles derived from the square root function. This helps engineers determine optimal designs that ensure stability and efficiency. Additionally, the square root function is essential in various calculations related to force, pressure, and material strength, enabling engineers to create safe and functional structures.
This curve is a fundamental mathematical concept with wide-ranging applications in physics, economics, biology, and engineering. Its ability to model relationships and describe behaviors in these fields demonstrates its importance in both theoretical understanding and practical problem-solving. By leveraging the insights provided by the square root function, professionals across disciplines can enhance their analyses and improve decision-making processes.
Relation to Other Mathematical Concepts
The square root curve is intrinsically related to the parabola, specifically serving as its inverse. The parabola is represented by the equation y = x², which describes a U-shaped graph that opens upwards. As such, for every positive value of y, there are two corresponding x values (one positive and one negative) that satisfy the equation. In contrast, the square root curve, represented by y = √x, effectively reverses this relationship. It takes the output of squaring a number and provides the original input, making it a crucial tool for understanding the properties of parabolic functions.
Comparison with Cube Root Curves
In comparison to cube root curves, which are defined for all real numbers, the square root curve is restricted to non-negative values, specifically x ≥ 0. This limitation arises because the square root of a negative number is not defined within the realm of real numbers. Therefore, while cube root functions can produce outputs for any input, the square root function only exists in the first quadrant of the Cartesian plane, making its domain more specific and its graph distinctly limited to positive x values.
Inverse Functions
The square root function plays a vital role as an inverse function, effectively “undoing” the operation of squaring a number. This property is essential in various mathematical equations and transformations. For instance, if you have an equation involving squares, such as x² = 9, applying the square root function allows you to solve for by yielding the solutions x = 3 and x = −3. This versatility makes the square root function indispensable in algebra, calculus, and other fields of mathematics, where solving for unknowns and transforming equations is frequently required.
Common Misconceptions
- Misconception: The Square Root Curve Exists for All Real Numbers
- Reality: The square root curve is only defined for non-negative values of x (i.e., x ≥ 0).It doesn’t produce real outputs for negative inputs, which can confuse its domain.
- Misconception: The Square Root Curve is Symmetrical
- Reality: The square root curve lacks symmetry and does not mirror itself like parabolas do. This asymmetry is a key characteristic of its shape.
- Misconception: The Square Root Function is the Same as the Cube Root Function
- Reality: While both the square root and cube root functions are types of root functions, they behave very differently. The square root function exists only for non-negative x, while cube root is defined for all x.
- Misconception: The Growth Rate of the Square Root Curve is Constant
- Reality: The growth rate of this curve is not constant; it decreases as x increases. Initially, the curve rises quickly, but as x becomes larger, the increase in y becomes less pronounced. This reflects the concept of diminishing returns inherent in the square root function.
- Misconception: The Square Root Function is Only Used in Mathematics
- Reality: The square root function has numerous practical applications beyond mathematics. Researchers use it in physics to model motion, in economics to analyze diminishing returns, in biology to study growth rates, and in engineering for design and structural analysis. Its relevance in real-world scenarios illustrates its importance across various fields.
Conclusion
The square root curve is a key mathematical concept with diverse applications in physics, economics, and engineering. Its graph represents the relationship between numbers and their square roots, starting at the origin (0, 0) and rising gradually as x increases. This continuous and increasing nature allows for valuable insights into mathematical relationships and problem-solving.
Understanding this curve enhances our grasp of key principles, such as diminishing returns and growth rates. Additionally, it serves as the inverse of the parabola, connecting it to other mathematical concepts. Exploring its properties and uses deepens our appreciation for the square root function’s real-world impact. Ultimately, mastering this concept not only strengthens our mathematical skills but also equips us to apply these insights effectively in various disciplines, fostering analytical thinking and informed decision-making.
FAQs
- What is a square root curve?
It’s the graph of the square root function y = √x. - What is the shape of the square root curve?
It starts at (0,0) and rises gradually as x increases. - What are the domain and range of the square root curve?
Domain: x ≥ 0, Range: y ≥ 0. - Does the square root curve extend to negative x?
No, it only exists for non-negative x in real numbers. - How does the square root curve relate to parabolas?
It’s the inverse of a parabola with the equation y=x². - Can the square root curve shift or stretch?
Yes, transformations like y = √(x−3) or y = 2√x modify its position or shape. - What are the key points to graph a square root curve?
Points like (0,0),(1,1),(4,2),(9,3) are easy to plot. - What are some real-world uses of the square root curve?
It’s used in physics, economics, biology, and engineering to model relationships. - Does the square root curve approach infinity?
Yes, but it does so gradually, with y increasing at a slower rate as x grows. -
Why is the square root curve important in math?
It helps solve equations, model data, and understand inverse relationships.
If you like this post, you may also like:

Thanks for reading, for more interesting articles, visit our homepage.